In this post, I express my own views and not those of my employer. It’s… spicy. 🌶️ In any case, I might adapt it for work at some point.
Talking about the hot labor market is so hot right now. Every pundit favors one econometric thermometer or another. One popular gauge: The ratio of job openings to hires. Its proponents call it a proxy for the average time to fill an opening. The longer the time to fill, the harder employers find it to hire, and the hotter the labor market. Simple, right? There’s just one hitch.
unknowable and meaningless.
When pundits use this metric to gauge the labor market’s temperature, they mislead the public by addressing an unanswerable question about labor demand and hiring. What’s worse, an answerable question stares them in the face. Worse still, a lack of data pushes an even better question out of reach.
It’s time to exorcise this metric from public discourse once and for all. At my side during this exorcism, an old friend, the ghost of John Graunt himself: event history analysis. This under-used analytical framework reveals the emptiness of the time to fill question and offers another in its place: “How often?” Moreover, event history analysis charts a path to data that bring a better question (“What are the chances?”) within our grasp.
The question that (pundits think) the ratio answers
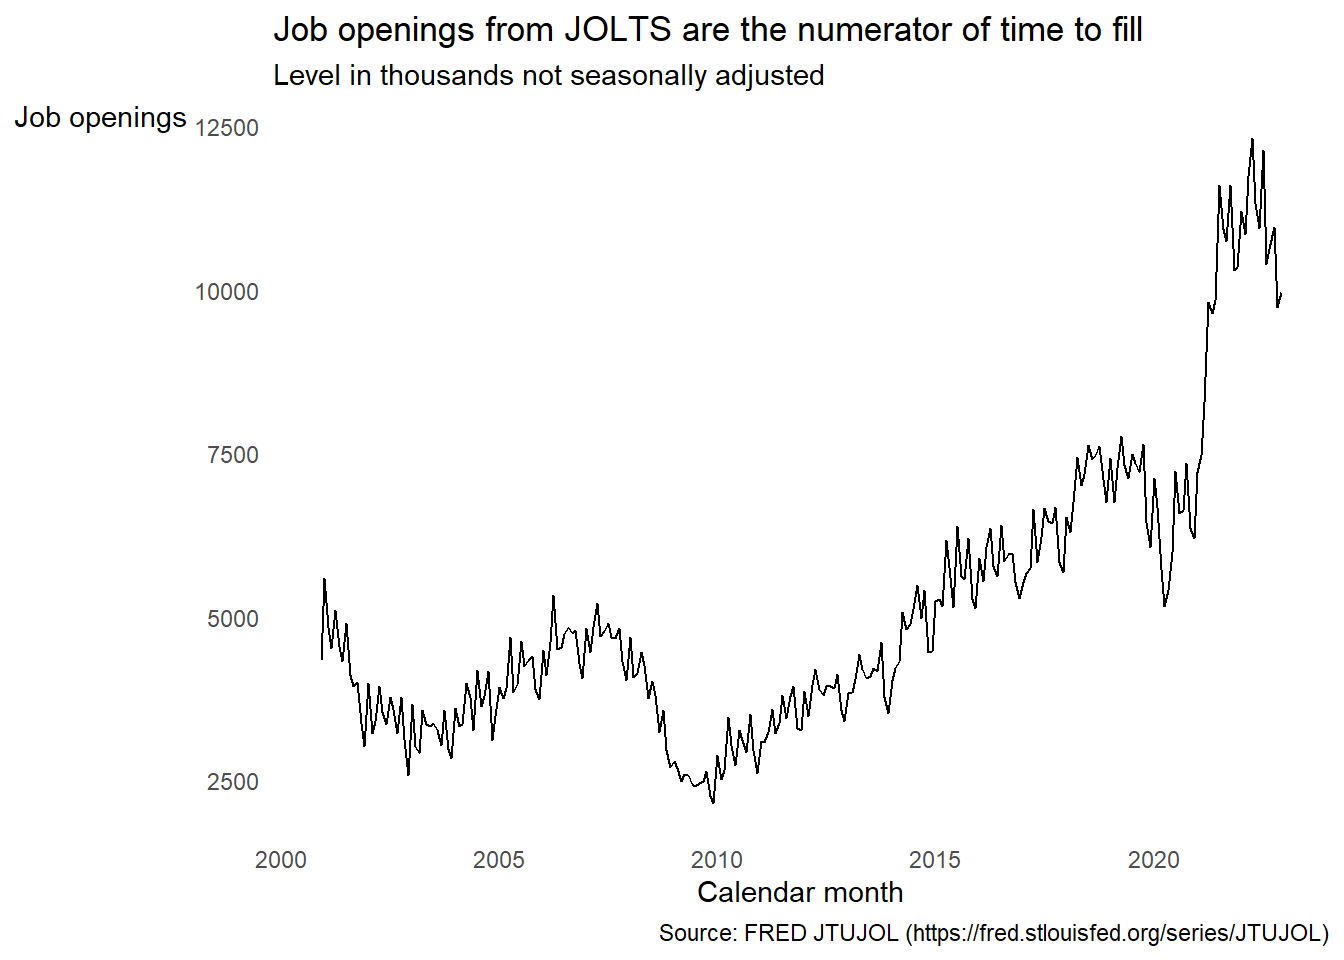
Among economists, the commonest way to calculate time to fill is from the job openings and hires counts from the the Job Openings and Labor Turnover Survey (JOLTS).
First, query the monthly job openings data:
Next you’ve got hires:
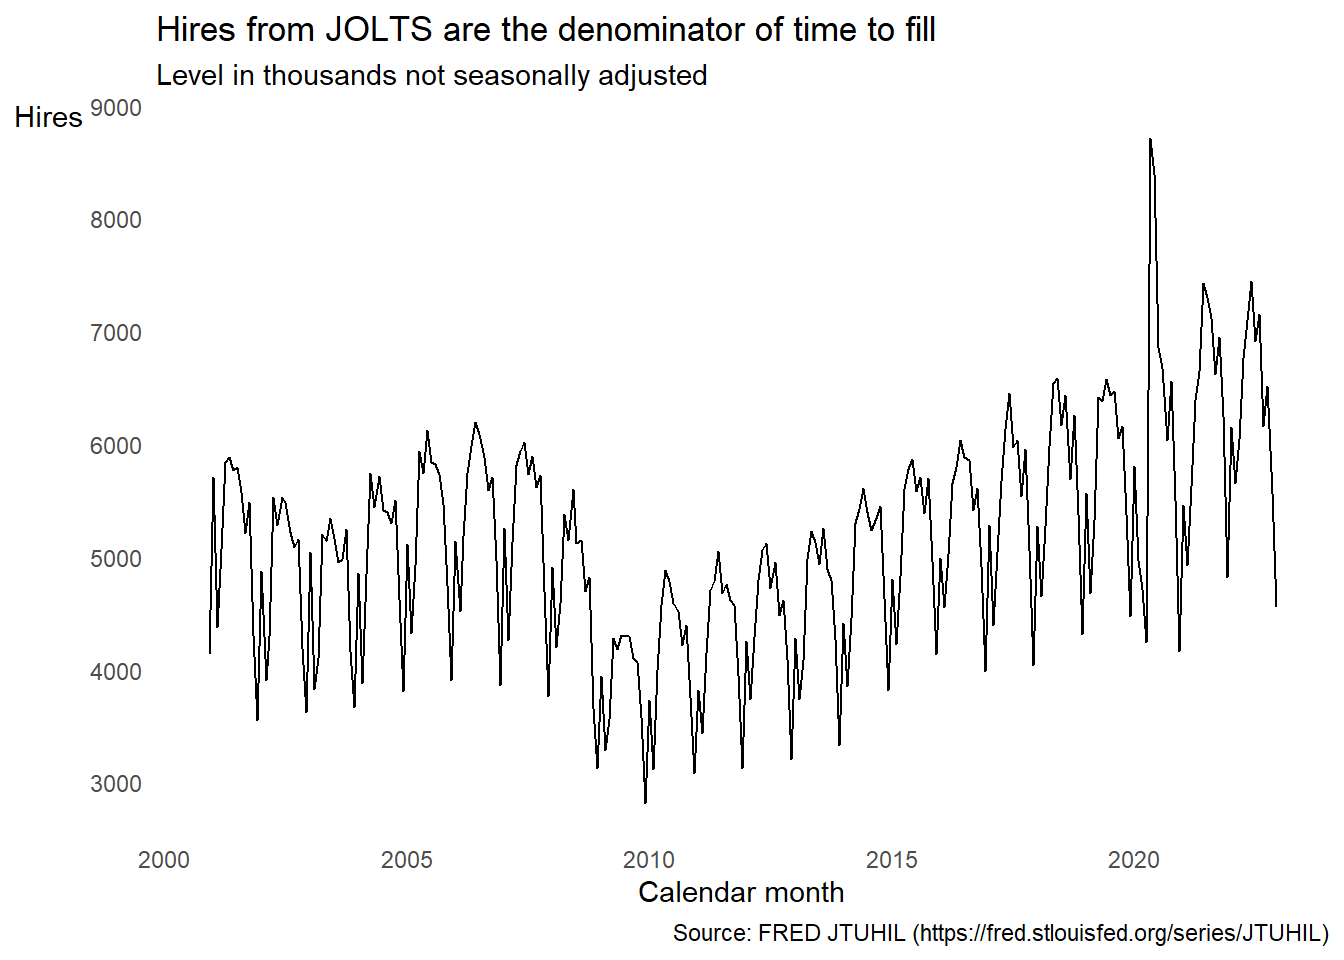
JOLTS counts active job openings (that is, job openings that employers were recruiting against) on the last business day of the month. This count approximates the total number of exact months that job openings were open and active1. Hires are the cumulative count of hires at the end of the month. This is a count of events. Divide the exact amount of time that units of observation (in this case, job openings) were exposed to the possibility of an event occurring (in this case, active job openings could get filled) by the number of times that happens, and you get an estimate of the expected time until the event occurs under prevailing rates. Some pseudo-math to illustrate:
\[ \begin{align} \textsf{Time to fill} & = \frac{\textsf{Months jobs open}}{\textsf{filled jobs}} = \frac{\textsf{Months open}}{\textsf{filled}} \\ & \rightarrow \ \textsf{"Months open per fill"} \end{align} \]
Do the division and some seasonal adjustment, and the ratio looks like this:
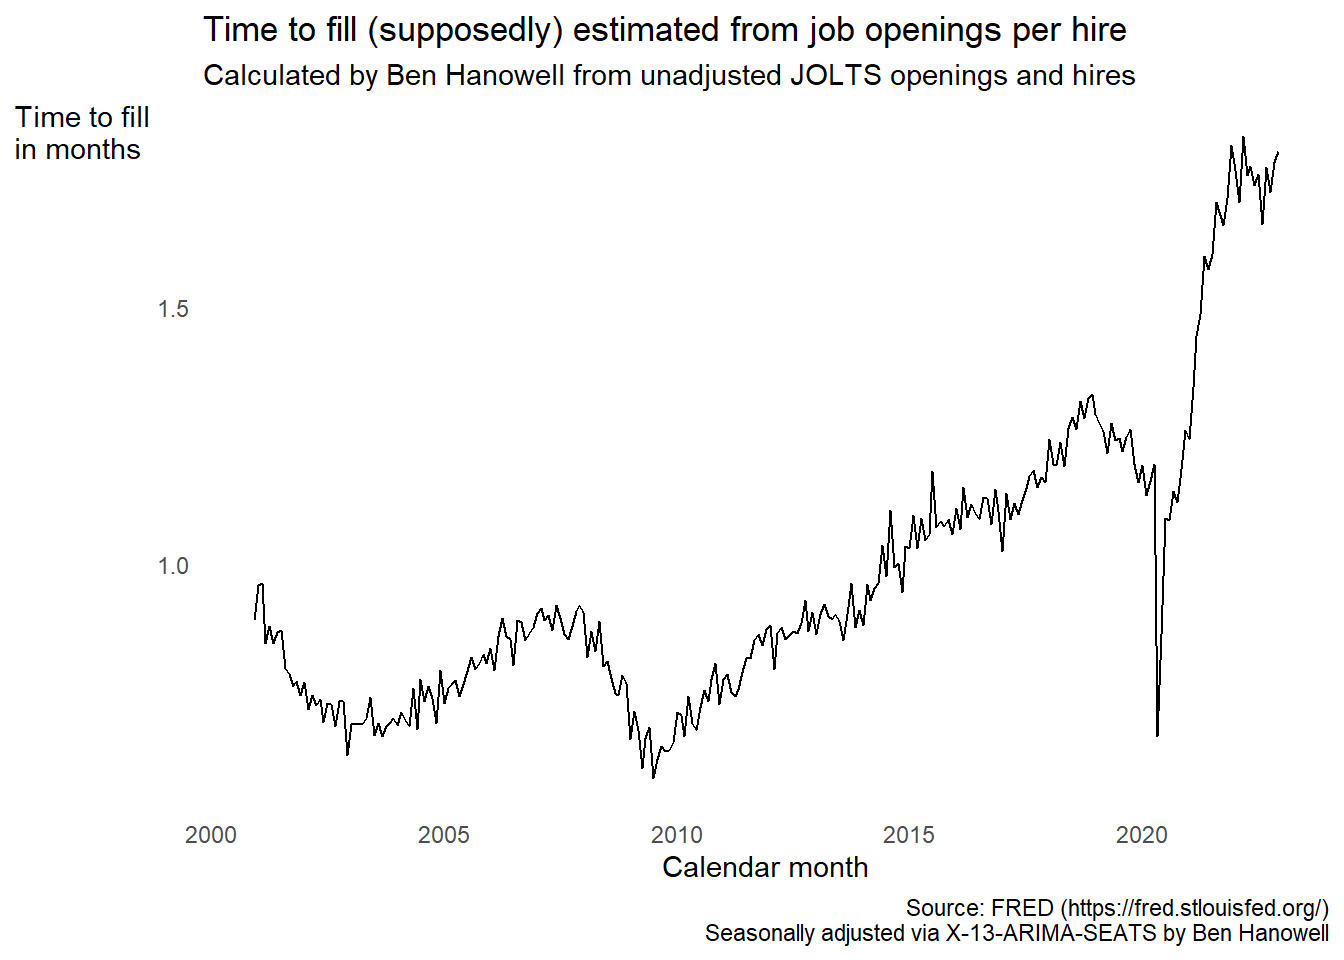
This picture of time to fill seems reasonable, right? It dipped after the dot com bust and 9/11, then climbed into the late noughties until the housing market crashed. It steadily rose during the long recovery from the Great Recession. Then it fell off a cliff with the COVID-19 shock. Finally, it rocketed upward as the economy awoke with a start and a cold sweat from pandemic shutdowns.
But that’s the trouble with patterns that seem to make sense. When it turns out they’re meaningless, it’s hard to toss them aside.
The problem is deeper than the definition of “job opening”
Lately, Federal Reserve Chair Jay Powell emphasizes job opening trends in his thinking about whether the economy needs another Fed interest rate hike to cool demand and decelerate price inflation. Because Powell focuses on job openings, they’re a mainstay of economic discourse on Twitter and LinkedIn, especially during #bumpsandsquigglesday2.
Preston Mui at Employ America already schooled us about our misguided obsession with job openings. These monthly counts from JOLTS tell us nothing about employers’ recruiting effort. Employers don’t treat all job openings in all months the same. Econometricians even developed a recruiting effort index to address this problem. Too few use it. FRED discontinued its series. A shame.
But even if every recruiter at every employer treated every job opening the same for all time, the ratio of job openings to hires would remain unknowable and meaningless. The question that ratio addresses would remain unanswerable. The temperature of the labor market would remain a mystery for lack of a better indicator.
The problem with time to fill isn’t a shallow definition of job openings. The issue lies deep in the guts of our implicit assumptions about the hiring process.
The meaninglessness of time to fill emerges from our mistaken assumption that the sole fate of job openings…
… is to get filled.
Worse things can happen to a job opening than getting filled
Anyone who works in recruiting will tell you that not all job openings get filled. In the recruiting world, job openings are called “reqs”, short for requisition, which is a word that means “an official request” (in this case, for headcount). Employers cancel reqs all the time, usually when their business isn’t doing well. Reqs get cancelled for other reasons, too. Perhaps the job’s labor pool is too small for the level of competition. Perhaps the employer opened an excess of reqs because they know not all of them will get filled. Perhaps the employer no longer needs people to work that job because they hired machines to do it instead. So the recruiter cancels the req. It never gets filled.
Alas poor req.
The only way to see how long it would take a cancelled req to get filled is to travel to an alternate reality where it wasn’t cancelled. Imagine that other universe. To do so, you must specify what about its circumstances made it so the req didn’t get cancelled. Is it just impossible to cancel reqs in that alternate reality, so people just leave them open but fill them at the same rate they do in our universe? Or are macroeconomic conditions different in that alternate reality, which influences both filling and cancellation? Perhaps the company had a better third quarter in that universe, or the labor pool was bigger, or there was less competition for hires. The answers to these questions determine whether or not you can answer your original one: “How long does it take on average to fill a req?”
Which of those alternate universes seems closest to ours? Surely not the one where it’s simply impossible to cancel reqs. A universe where the req got filled because circumstances were different seems more plausible. And that’s where the problem starts.
Think again of that poor cancelled req. You don’t know how long it would have taken to fill. You could guess at its time to fill by combining information about how long it was open, along with information about how long all other reqs were open that month until they were either filled or cancelled, or the month ended. You divide those req-months by the number of times reqs got filled and you think you’ve hit the target: expected time to fill.
Think again. That req was cancelled. Chances are it’s somehow different from the reqs that got filled that month, and that’s why it was cancelled. It’s also potentially different from the reqs that remain open because those reqs haven’t yet been cancelled.
By smooshing the req-months of cancelled reqs together with those of filled and still-open reqs, you’re assuming that the fill rate would remain the same if you could somehow add in those counterfactual req-months and filled reqs from those that got cancelled in our universe. In pseudo-math, your assumption looks like this:
\[ \begin{align} \textsf{Time to fill} & = \frac{\textsf{Months jobs open}}{\textsf{Jobs filled}} \\ & = \frac{ \textsf{Months jobs open} + \begin{align} & \textsf{Additional months that cancelled} \\ & \textsf{openings would have been open} \end{align} } { \textsf{Jobs filled} + \begin{align} & \textsf{Cancelled jobs that} \\ & \textsf{would have been filled} \end{align} } \end{align} \]
This will only be true if:
\[ \frac{\textsf{Months jobs open}}{\textsf{Jobs filled}} = \frac{ \begin{align} & \textsf{Additional months that cancelled} \\ & \textsf{openings would have been open} \end{align} }{ \begin{align} & \textsf{Cancelled jobs that} \\ & \textsf{would have been filled} \end{align} } \] This equality only makes sense in worlds where:
- No job openings are ever cancelled, or
- Job openings that got cancelled are exactly like the ones that don’t get cancelled or remain open
In other words, it only makes sense in alternate universes alien to our own. We probably descended from reptiles in those universes.

An image from the frightful universe where reqs never get closed. From Slate.
Dependent risks bring the pain
When two or more terminal events are possible, and one event’s occurrence precludes another, the system has what event history analysts call competing risks. When the mechanisms that influence the occurrence of one competing event are somehow coupled with the mechanisms that influence the occurrence of another, they are dependent competing risks.
I just laid out an informal argument (a narrative, really) for why, in the presence of dependent competing risks, it’s impossible to estimate the expected time until any of the competing events occurs. If you want a formal argument, look here in section 4.
To be fair, you’ve got two options to make this dependent competing risks problem go away. There’s just one snag. Both options are bad.
Bad option 1: Ignore the dependencies among the competing risks. You’re free to envision an alternate reality where only one of the possible events (in our case filling openings) ever happens, or where altering the mechanism that influences one event’s occurrence has no effect on other competing events. Maybe the dependency is weak enough to ignore. Fine. But what if it isn’t? And what if there is no way to empirically verify whether or not it is weak enough? Well, then you’re screwed.
Bad option 2: Find and adjust for all factors that generate the dependencies among the competing risks. In the case of time to fill, you’re effectively stratifying the ratio of job openings to hires into groups defined by the attributes relevant to both filling and cancellation. Now you’re comparing cancelled reqs to other reqs that are similar in every respect except they happened to get filled or remain open. By comparing similar reqs, you remove the dependency that makes time to fill unknowable. But good luck finding and properly adjusting for all those risk factors.
Thankfully, these two bad options are not your only options. As is often the case, the solution to the problem is to re-frame the question.
Instead of asking “How long will I wait?” ask “How often?”
The ratio of job openings to hires addresses an unanswerable question: How long is the expected waiting time from the req’s creation to the day someone gets hired?
Meanwhile, this whole time, an answerable question stared the proponents of this meaningless metric in the face. All you have to do is invert the ratio. Instead of calculating job openings per hire, do hires per job opening:
\[\frac{\textsf{Hires}}{\textsf{Job openings}}\]
This ratio is special: it’s a proper rate. A rate is a ratio that compares two quantities in different units of measurement. This becomes clear once you recall what I said before, which is the a count of monthly job openings approximates the time in months that jobs were exposed to the possibility of filling during that month:
\[\textsf{Job openings} \approx \textsf{Months jobs open}\]
And so:
\[ \frac{\textsf{Filled jobs}}{\textsf{Job openings}} \approx \frac{\textsf{Filled}}{\textsf{Months open}} \rightarrow \textsf{Filled per month open} \]
The numerator is in units of people hired. The denominator is in units of time (exact months) that jobs were open. This rate is a special kind of rate: an exposure rate. An exposure rate measures the amount of times an event occurs per unit of time that the event could have possibly occurred. It answers the question: “How often does the event occur?”
“How often” is a question that we can answer without taking a trip into an alternate reality that is difficult if impossible to adequately define. For that reason, it’s answerable even in the presence of dependent competing risks. Why? Because we’re dividing the event count only by the time the event could have possibly occurred in our universe. We’re not asking a hypothetical question about how long it would take for all reqs to get filled, including those that got cancelled.
The more often hires occur, the easier employers find it to hire people, and the looser the labor market. Let’s take a look at it.
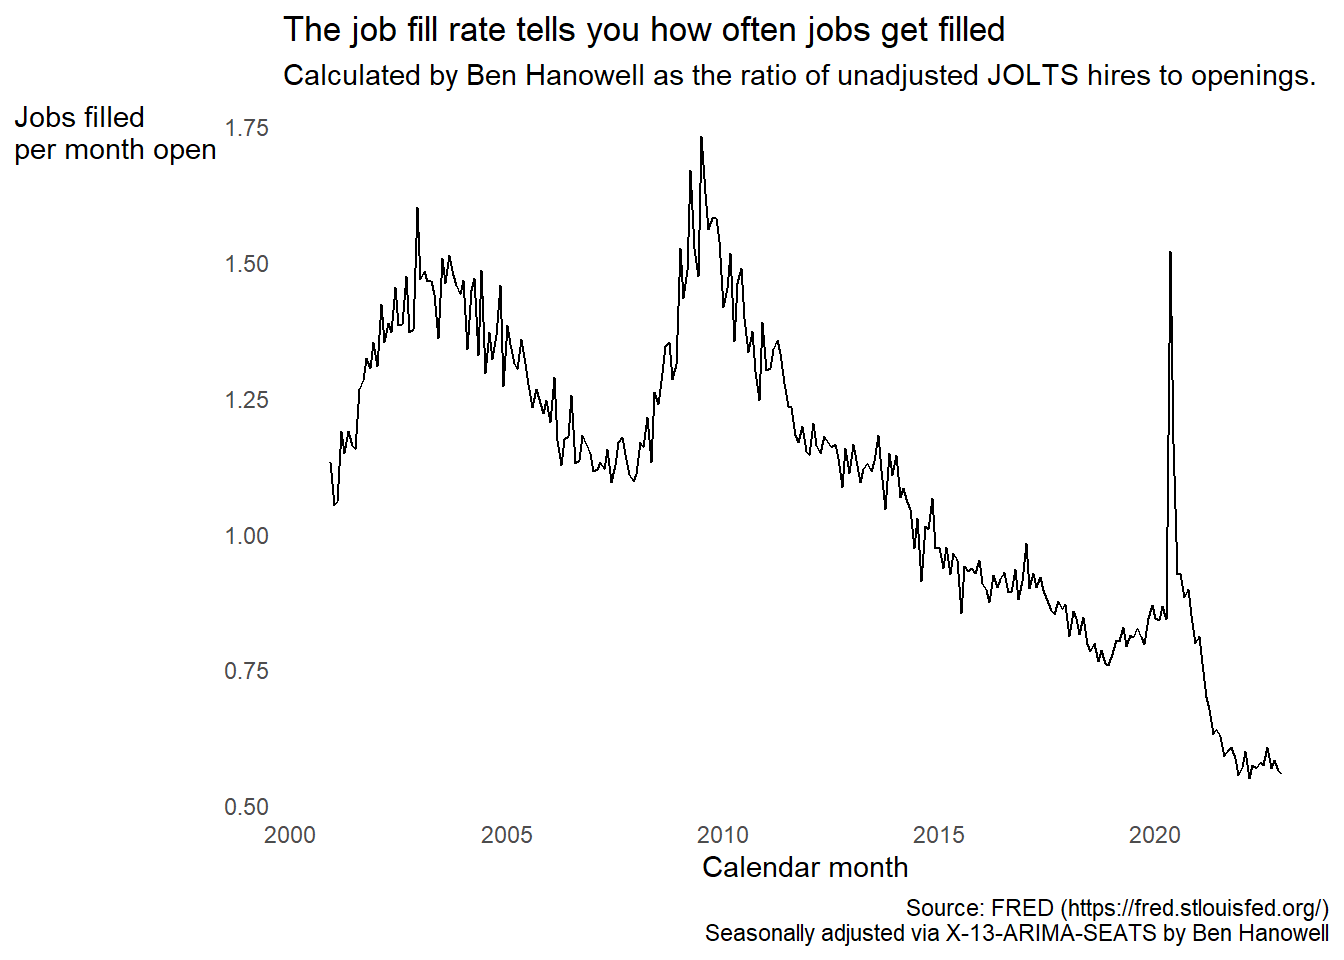
The fill rate series shares all the hallmarks of the time to fill series, but the pattern is inverted because the metric is inverted. The difference is that every single point on the fill rate curve represents a measurable quantity of this reality. That means every comparison between points on the fill rate curve is meaningful. That means the trends in the fill rate are meaningful. Even if the trends in the time to fill curve seem to jive with our expectations, that doesn’t make them meaningful.
Indeed, there are noticeable differences in the patterns of these two curves once you take their absolute percent difference from some index month.
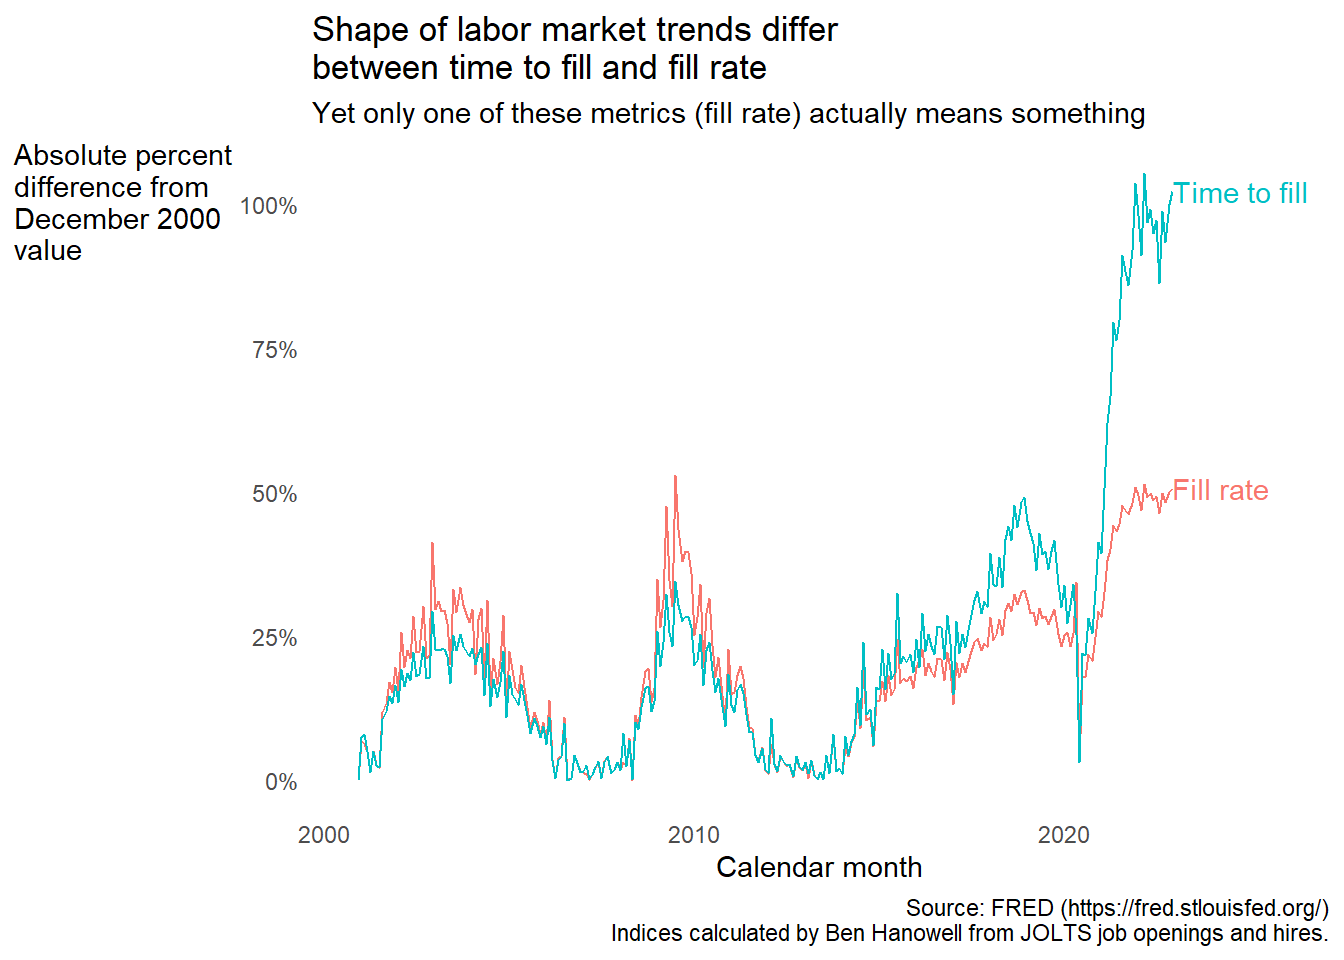
The dot com and housing market bust effects look larger for the fill rate than for time to fill. The recovery from the Great Recession is more rapid for time to fill than the fill rate, and post-pandemic time to fill wins the rocket launching contest against the fill rate. These anomalies can’t be explained away by the two metrics being measured on widely different scales. Still, pedants might quibble that the numerical instability of percent change metrics could explain the discrepancy. Others would point to esoteric mathematics about the effects of inverting ratios.
But like… why bother figuring out why the shape of the two trends is different in the first place? The fact that they are different at all is problematic. An easy way to solve that problem is to figure out if one of the series is utterly meaningless, which time to fill is. So just use the series that isn’t meaningless, which is the job fill rate, and ignore that other one.
“But time to fill is a more intuitive metric,” you might say. And I answer, “What’s worse: Spending an extra minute to explain how to interpret a metric, or showing someone a trend line based on a metric that is unknowable and meaningless?”
Besides, is a basic exposure rate so hard to explain? Having explained exposure rates multiple times to non-experts, I say no. No it is not. Moreover, we already report exposure rates each month with the JOLTS job openings, hires, and separations rates, which are rates per unit of employment time.
The choice is crystal clear. Still, the fill rate is only the best contender out of two crummy picks.
If only we could ask, “What are the chances?”
The ratio of hires to job openings answers the question, “How often do job openings get filled?” Yet it tells us nothing on its own about the extent to which the filling of job openings competes with the risk of their cancellation. If we knew that, we could answer the question, “What is the chance that a job opening will get filled before it gets cancelled?” And if we also knew the chance that a job got cancelled before it got filled, and how these two probabilities are changing over time, we could learn a lot more about the potential fate of a job opening.
In a perfect world where we’re all descended from reptiles and it’s impossible to cancel job openings, deriving the chance a job gets filled within a given time frame is easy to derive from the job fill rate:
\[ \textsf{Chance of filling within } T \textsf{ months} = 1 - \textsf{exp}\left[-\left(\textsf{monthly fill rate}\right) \times T\right] \]
It gets slightly more complicated when we have to account for the competing risk of cancellation. But it turns out that the chance of each event occurring in a given time frame is proportional to the ratio of its rate to the sum of all event rates. If the cancellation rate increases but the fill rate falls or stays the same, the chance of cancellation will rise at the expense of filling, and vice versa.
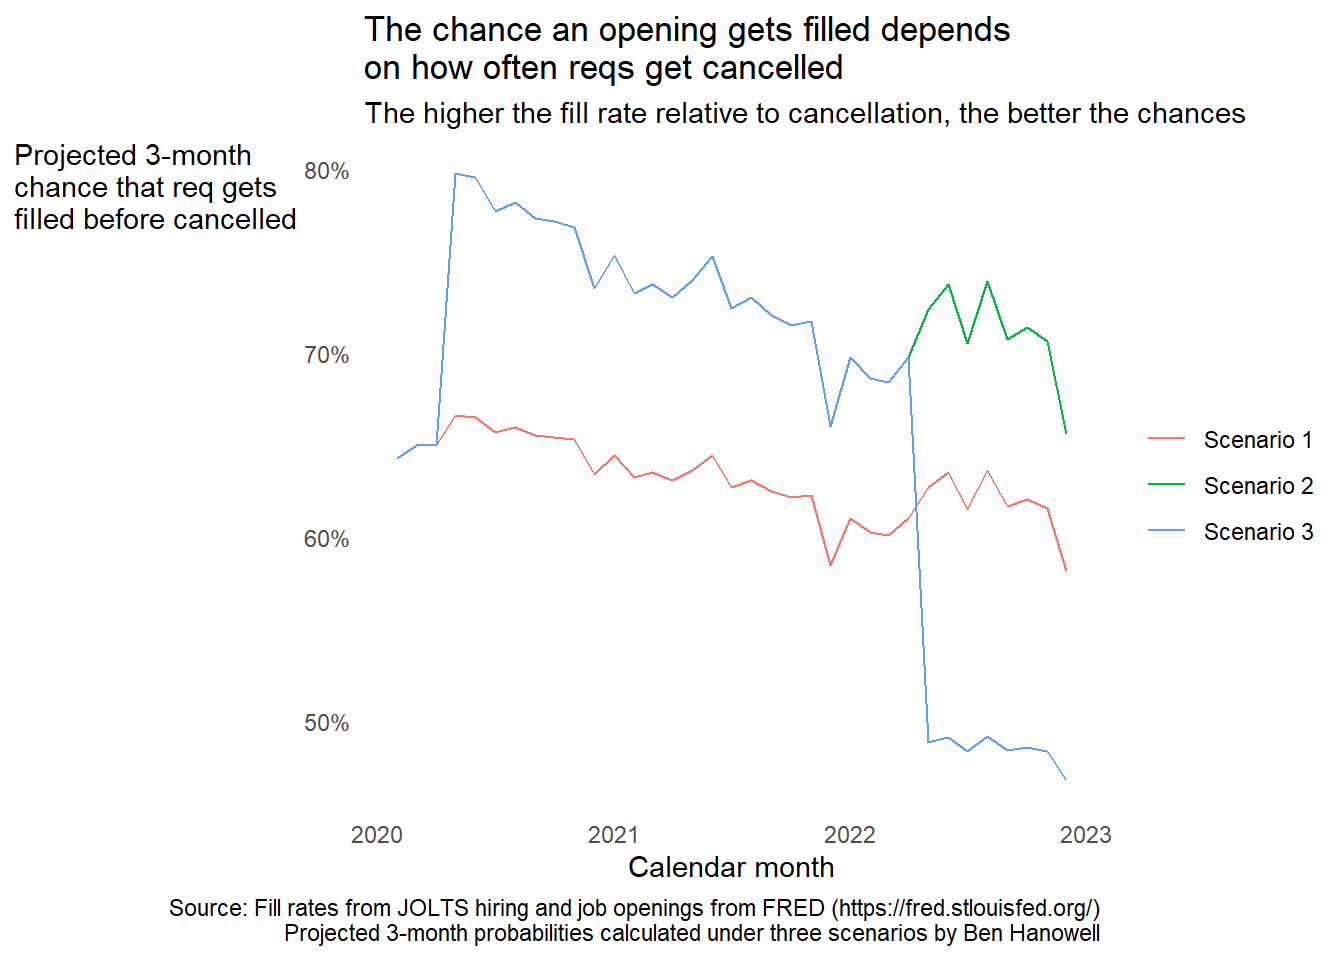
Depending on what happened with req cancellations, the fate of a job opening might look very different. Consider three hypothetical scenarios:
- The cancellation rate is always half the fill rate.
- The cancellation rate is half the fill rate until the end of the pandemic recession, when it becomes a quarter of the fill rate.
- Just like scenario 2 except the cancellation rate quadruples after the Fed starts hiking interests rates, when the cancellation rate becomes equal to the fill rate.
Below are three time series of the projected chance a job gets filled vs. cancelled within three months, one series for each scenario.3. Under scenario 1, the chances diminish gradually, with a possible post-pandemic bump. Under scenario 2, the chance of filling increases after the pandemic recession ends because employers start cancelling reqs less often. That happens under scenario 3, too, up until the Fed starts hiking interest rates and employers start to cancel reqs as often as they fill them. These scenarios differ starkly from one another in their representation of the risks and opportunities faced by both job candidates and employers. Unfortunately, we have no way to tell which of these scenarios (if any) reflects reality. JOLTS collects no information from employers about req cancellations.
Applicant tracking systems to the rescue, but it’s gonna be a slog
Applicant tracking systems are software and service platforms that employers use to create and manage reqs, as well as track candidates through the application process. Human capital management systems are platforms that employers use to manage their workforce once they’re hired. To calculate fill and cancellation rates, we need a representative sample of job requisitions along with the dates they were opened, and dates when they were cancelled or filled if applicable. We also need the dates when people were hired, and which req the hire filled. From these event logs we can reconstruct the numerators of both fill and cancellation rates, along with their shared denominator. From there we get the answer to the question: “What are the chances?”
This will be tough for the following reasons:
- Employers may use multiple systems, and trust me… they often don’t combine these systems into a coherent recruiting database.
- Not all requisitions are the same. Believe it or not, some reqs represent a single position, whereas others represent tens or hundreds or thousands of positions, and the number of positions often changes.
- Event dates are in many cases logged manually, or automatically by poorly-designed or fault-intolerant software, and that leads to curious data entry errors.
In short, the data is a mess. Time to clean it up if we want to gauge the labor market’s temperature.
Application tracking and human capital management system vendors: Let’s get on this.
Yes, it’s a common mistake
Don’t believe me that major players use the ratio of openings to hires? The Conference Board updates this chart monthly. Look familiar?
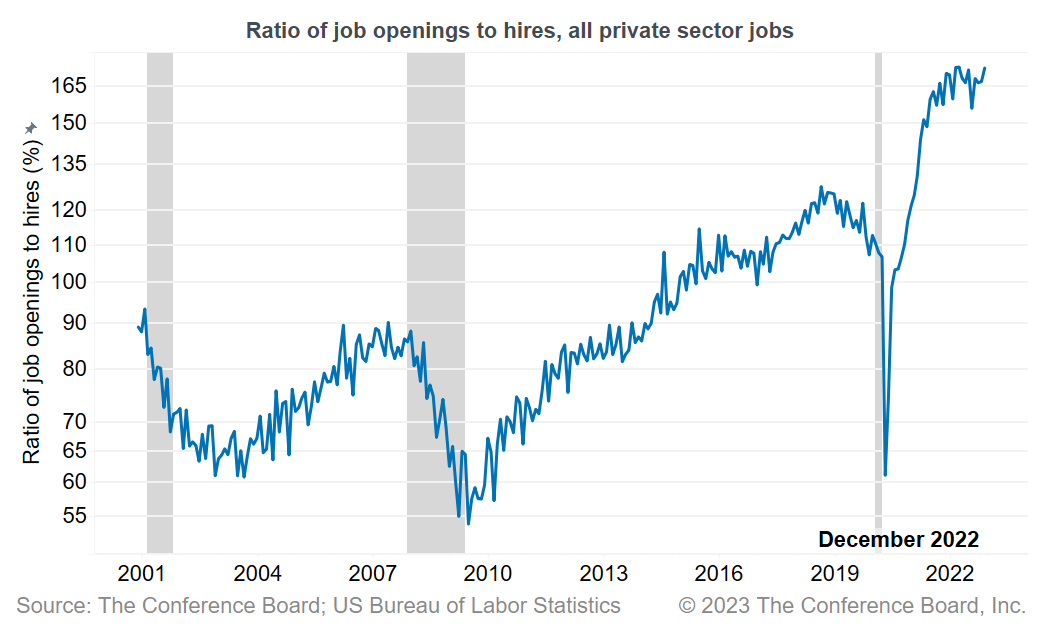
The Conference Board time series chart showing the ratio of job openings to hires
The Burning Glass Institute does it, too. And lest you think I’m picking on Gad Levanon (I admire your work, Gad), none other than the St. Louis Fed (home of the invaluable FRED) commits this flagrant foul on the regular. And St. Louis ain’t alone. The Philadelphia Fed ranked U.S. metropolitan areas by time to fill, referencing the metric so often in a February 2020 report that they gave it an abbreviation: TTF4.
TTF? More like WTF.
It’s even worse than all that
Each month, JOLTS asks employers the number of job openings where they’re actively recruiting. So far, we’ve assumed that a job opening is created, and it is active until it gets filled or cancelled. Yet in reality, reqs can bounce back and forth between active and inactive status, which means that inactivity is a reversible state. The reversibility of the inactive state complicates the estimate of the chance a req gets filled or cancelled within a given time frame.
But wait, there’s more: Reqs can also be repurposed for other roles, which effectively means they are cancelled and that another req is created in its place, only for different headcount.
It’s a jungle out there. Slowly, we’ll traverse it. This time, I figured it was enough to call to your attention that filling isn’t the only thing that happens to job openings, and therefore time to fill is meaningless.
So please never report it ever again. Thanks.
A possibly bad approximation for reasons beyond the scope of this post. See my LinkedIn post and my introduction to demography course notes to teach yourself why.↩︎
My pejorative hashtag on any economic data release day.↩︎
These scenarios assume constant fill and cancellation rates.↩︎
The same abbreviation used by almost every human capital management and applicant tracking system on the market.↩︎